Showing posts with label DevOps. Show all posts

Tuesday, June 2, 2026

LLM Pipelines

June 02, 2026 0

We can incoporate 3 ways of LLM through pipelines:

1) DAG workflow
a) Pre designed prompts + code paths
b) Modular components [Yes or No prompts]
2) Agents
LLM setups to make their own decision
3) Agentic workflows
Hybrid architecture


We can create a work flow through LangChain and LangGraph.

LangChain:
It is designed for LLMs. It can be useful for custom workflows, tool integration and agent collaboration. 
LangGraph:
LangGraph library used for build a stateful, multi actors with LLMs

LangGraph concepts:
State: a TypeDict that flow through graph and updated by each nodes.
Nodes : Python function used to receive update and return updates
Edges : Connection between Nodes
Reducter : control how state updates combine with over write or accumalation


Retrieval Augmented Generation (RAG)
A RAG is an interactive system (chatbot) that combined a retrieval (static content) with a dynamic conversation generator.

Components of RAG:
An index : A mechanism to convert a raw data into Vector database
A retriever: Closed tied to the index and retrieve a data from database based on query
A generator : an LLM to reason a through user query and the retrieval knowledge to provide an inline conversational response.

Sementic search:
A system has understand of context and meaning of user query and matches against the available document for retrieval. It can find relevant document without having to rely on exact words or n-gram matching. It often uses a pre-trained large language model to understand the nuance of the query and the documents.
We often use of cosine similarity to define a raw data that produce in vector database.
Cosine is bounded between 1 and -1.
smaller angle == Cosine [up]
larger angle == Cosine [down]
Perpendicular == Cosine 0


Dense Model:
A dense model uses all the parameter for every tokenized. It would be better for semantic similarity, paraphrases and conceptual queries. [Example GPT3 & GPT4 are using Dense model]
Pros:
* Easier for training the model
* Simple architecture
Cons:
* high computation cost
Sparse Model:
A sparse model is used for small set of parameter for each token. The most common Sparse architecture is Mixure of Experts.
Pros:
* Less computation cost
* Better scaling efficiency
Cons:
* Potential training
* More complex architecture


Cross Encoders:
A cross Encoder is a non-generative LLM specifically designed to take in two inputs separated by a special token and return a single output.[Ex. BERT]

Reasoning LLMs:
Reasoning models like Deepseeks R1, OpenAI are orginal "o" series and Anthropic's Claude/Opus 4 models are autoregressive LLMs that have been trained to give a discursive chain-of-thought reasoning step before giving a user response.
For example, the Claude 4 series of LLMs provide separate reasoning tokens alongside the messages to the user, as is common with most frontier reasoning LLMs.


Agents:
1) Solo Agents
2) Supervisor + specialist agent


Wednesday, April 22, 2026

GIT Basics

April 22, 2026 0


 GitHub: It is a cloud based platform which provides distributed version control and source management system.

Alternative source mangement system:

  • Github
  • Bitbucket
  • GitLab
  • SVN
GIT Algorithm:
It will hash out of content (produces 40 char hex string)
It will create a file name same as hash
Zip up with your content and stored inside of file.
#git add test.txt
#cat test.txt | git hash-object --stdin
blob:
It is convert a file into hash file.
Hash algorithm will create a hash file according the file contents. It will not create a two dfferent hashing file if both both files are having a same contents.
#git write-tree : It will display the tree structure of GIT
#git cat-file -p hashfile : Read a content inside of hashfile
Git Commit:

Commit is a copy of snapshot. It will create a read only file whenever we performed a commit. The previous content or update will be there and would not be destroyed,
Merkle Tree: A tree structure in which each leaf node is a hash of a block data and non leaf node is a hash of its children.
Head:

Merge:
It merge one or more commit into branch.


Saturday, April 4, 2026

Deep Dive of Kubernetes Network

April 04, 2026 0


K8S is a dynamic network. Pods are ephemeral.  IP change on every restart.

Containers with in the pod shared a single network namespace.

K8S networking Model:

1) Every Pod receive a unique and cluster wide IP address.

2) All pods on the same node can communicate directly without NAT

3) All pods on different nods can communicate directly without NAT

4) A Pod self seen IP is identical to the IP other pods use to reach it [Flat network]

Kubernetes specifies what is required and CNI plugins decide How to implement it

Communication pattern in K8S

Container to Container - within same pod via loopbackup [127.0.0.1]

Pod to Pod - Direct IP communication across nodes without address translation

Pod to Service - Kube proxy intercepts traffic and load balancing to healthy end points

External to Service - Exposed via NodePort, LoadBalance type or Ingress controller

Node to Pod - Kubelet and monitoring agents


Kube-Proxy:
Kube proxy runs on every node as a DaemonSet and part of the Kubernetes control plane. It watches API sever for any change of resource or end points. API server initate a end point object when selector create a resourece.  Kube proxy is maintaining a chain of IP table mode. I used to maintain local and forward routing.  IPVS is a kernel level virutal load balancer. It will handle thousand of service request and routing at a same time.
Pod to service will take care of kube proxy and pod to pod communication will take care of CNI.
CoreDNS:
CoreDNS is the cluster DNS server and deployed as a deployment in the kube system namespace.Every pod of /etc/resolv.conf is inject to point into CoreDNS.
Pod Networking:
Each pod has an Own network namespace and fully isolated stack. The namespace contain virutal vNICs, routing table and iptable rules.

Infra [pause] container creates and own a network namespace for the pod. All application containers in the Pod share the Infra container namespace at startup.

Virtual [veth] pair : Two virtual NICs connect between Pod and Node side. One end lives inside the Pod's network namespace [eth0] and other end is attached to Node like linux bridge [cbr0]

Traffic flow : Pod [eth0] -> veth pair -> host bridge -> node routing table -> destination 

Cross Node communication:
Node to Node communication is used Overlay approach and Underlay approach.
Overlay approach is encapsulated a traffic and decapsulated from destionation node.
Underlay approach is a direct routing method.
Modern CNIs like calico & cilium will support both approach.
Overlay (VxLAN/Geneve) - It is universal compatibility and cloud friendly. It will support upto 50 bytes per packet if MTU set to 1450
Underlay - It required physical network to accept and route through BGP routing

Analysis a packet flow under flannel CNI.

controlplane:~$ kubectl get pods -n kube-flannel -o wide

NAME                    READY   STATUS    RESTARTS   AGE   IP            NODE           NOMINATED NODE   READINESS GATES

kube-flannel-ds-5sv5v   1/1     Running   0          15m    controlplane   <none>           <none>

kube-flannel-ds-n7dxx   1/1     Running   0          15m     node01         <none>           <none>

controlplane:~$ 

node01:~$ tcpdump -i flannel.1 -n 'tcp' -vvv

tcpdump: listening on flannel.1, link-type EN10MB (Ethernet), snapshot length 262144 bytes

^C

0 packets captured

0 packets received by filter

0 packets dropped by kernel

node01:~$ 

Service:

K8S will face very difficult to manage an IP address across PODs. This issue will fix by service which providing an stable virtual IP (Cluster IP). It will act as a load balancer across all the pods. It will enable a loose coupling within application.

Service components:

Selector : Determines which pods belongs to this service
Cluster IP: Virtual IP assigned by K8S
Port: The port of the service listens on
TargetPort: The port on the container that the service forwards traffic to
Endpoints: The actual pod IPs and ports maintained by the endpoint controller
Metadata: Name, namespace, and labels for the identification and discovery
DNS Service:
CoreDNS will create a DNS record for service by automatically
FQDN format: <Service name>.<namespace>.svc.cluster.local
Short names: same namespace can be used as <servicename>
Search Domains: Kubernetes injects search paths for automatic resolution
A Records : Return the ClusterIP for standard Service lookup
SRV Records: For advanced applications needing protocol and port information
Kube-Proxy:
It is running as DameonSet on every Node and responsible for Service networking
Use Linux Kernel iptables rules for packet filtering and NAT
CoreDNS Configuration:
ConfigMap-based : All configuration in /etc/coredns/Corefile ConfigMap
plugins : Support for various plugins [K8S, etcd, forward]
Zone Configuration : Define which domains Core DNS manages
Upstream DS : can forward unknown queries to external DNS servers
Caching : Caches DNS responses to reduce latency and load
Logging : Can enable query logging for troubleshooting
Common issues related to Services:
Service is not reachable - We need to verify the selector label should match with Pod labels.
Some Pods are not receiving traffic - Validate the pod readiness status and liveness probes.
DNS is not resolving - We need to validate the CoreDNS in kube-system namespace
High Latency - Validate the kube-proxy mode, It may be iptables overhead
Uneven load distribution : Check pod resources and scheduling across nodes
Service IP not allocated : Verify Cluster IP range configured and available
Deployment Methods:
Multi tier applications : Cluster IP for backend and LoadBalancer for frontend
Hybrid deployments: Database might be deployed in cloud and services were deployed in Local
Blue-Green deployment : The customer has 2 types of setups for Prod, They will tested in standby before applied in active production environment.
Canary Deployments : They will segregate a loads through LoadBalancer and send 10% of loads into latest deployment.
Service Mesh Integration : Using Services as foundation for advanced networking
Multi-cluster : Services can be federated across multiple clusters.
Created service with Cluster IP for Web application:
ontrolplane:~$ kubectl get pods -o wide
NAME                   READY   STATUS    RESTARTS   AGE   IP           NODE     NOMINATED NODE   READINESS GATES
web-64c966cf88-45528   1/1     Running   0          20s   10.244.1.5   node01   <none>           <none>
web-64c966cf88-4x8xq   1/1     Running   0          20s   10.244.1.4   node01   <none>           <none>
web-64c966cf88-n66tm   1/1     Running   0          20s   10.244.1.3   node01   <none>           <none>
controlplane:~$ kubectl expose depolyment web --name=web-service --t^C
controlplane:~$ kubectl expose deployment web --name=web-service --type=ClusterIP --port=80 --target-port=80
service/web-service exposed
controlplane:~$ kubectl describe service web-service
Name:                     web-service
Namespace:                default
Labels:                   app=web
Annotations:              <none>
Selector:                 app=web
Type:                     ClusterIP
IP Family Policy:         SingleStack
IP Families:              IPv4
IP:                       10.97.253.216
IPs:                      10.97.253.216
Port:                     <unset>  80/TCP
TargetPort:               80/TCP
Endpoints:                10.244.1.3:80,10.244.1.4:80,10.244.1.5:80
Session Affinity:         None
Internal Traffic Policy:  Cluster
Events:                   <none>
Created a test CoreDNS service and validate with Cluster IP address of Web application:
ontrolplane:~$ kubectl run -it --image=nicolaka/netshoot --restart=Never test-dns -- sh
All commands and output from this session will be recorded in container logs, including credentials and sensitive information passed through the command prompt.
If you don't see a command prompt, try pressing enter.
~ # nslookup web-service
;; Got recursion not available from 10.96.0.10
Server:         10.96.0.10
Address:        10.96.0.10#53

Name:   web-service.default.svc.cluster.local
Address: 10.97.253.216
;; Got recursion not available from 10.96.0.10
Ingress and Ingress Controller:
Ingress controller continuously monitor the Kubernetes API for Ingress, Service and Secret changes.
Configuration Generation : Controller will generate a configuration for underlying of Load Balancer  if detect any changes in API and.
Configuration Push : Updated configuration is applied to the actual load balancer or reverse proxy daemon.
Health Checks: Controllers verify backend services are healthy and update routing accordingly
Event-Driven: Entire process is asynchronous and event driven.
Backward Compatibility : Controller will ensure that exist traffic is not disrupted during configuration changes.
NGINX Ingress Controller:
* Most widely adopted controller in production and maintained by the community and NGINX.
* NGINX open source reverse proxy as the underlying HTTP/HTTPS server
* Rich Feature Set: Rate limiting, request/response rewriting, WAF integration, mutual TLS, JWT validation
Traefik - Modern & Cloud Native Option
* It is build for Kubernetes and microservice. It doesn't require service reboot while ingress configure changes.
* Buit-in Web UI and REST API for monitoring and management
* Powerful middleware chain for request transformation
* Lower memory and CPU consume compare to NGINX.
Other Popular Ingress Controller:
AWS ALB Controller : Provision AWS application Load Balancers directly, native AWS integration.
GCP Load Balancing : Google Cloud's integrated solution with advanced routing and DDoS protection
Azure App Gateway:  Microsoft managed ingress solution with WAF and SSL offloading
Istio Ingress Gateway: Service mesh approach, combines ingress with advanced traffic management and security policies
Cilium Ingress Controller: eBPF based controller, ultra high performance and advanced networking features.
Configure TLS in Ingress resources:
TLS Block Structure : Specify hosts, Secret Name and optional Paths.
tls:
- hosts:
    - api.test.com
    - web.test.com
  secretName: my-tls-secret
Secret Format: Kubernetes TLS secrets contain tls.cert and tls.key [private key] as base64 encoded data
Hostname Matching: TLS certificate hostname must match the Ingress host specification, mismatches cause browser warning.
Wildcard Certificate : Support *.test.com to serve multiple subdomains with single certificate
Mixed protocol : It can serve simultaneously for HTTP and HTTPS.
Controller Specific : Different controllers may support additional TLS features vis annotations
Advanced Routing Patterns:
Header based routing : Route based on HTTP headers controller
Query parameter Routing : Some controllers support routing based on query parameters
Weight Based Routing - Distribute traffic percentage wise across multiple backends
Request Transformation : Add/modify headers, append/strip paths before sending to backend services
Rate Limiting : Limit request per IP, hostname or custom key
Authentication/Authorization : Some controllers will support JWT validation, OAuth flows or mutual TLS verification at ingress.
Gateway API:
K8S is having limited Ingress by design. Gateway API will use to over limit of Ingress. It has a three Layers. 1) GatewayClass (controller implementation) 2) Gateway (listener and security config) 3) HTTPRoute (routing rules)
HTTPRoute is similar to Ingress rules but more flexible and reusable across multiple Gateways.
Create an Ingress controller:
controlplane:~$ kubectl create namespace ingress-ngnix
namespace/ingress-ngnix created
controlplane:~$ kubectl apply -f https://raw.githubusercontent.com/kubernetes/ingress-nginx/controller-v1.8.1/deploy/static/provider/baremetal/deploy.yaml
namespace/ingress-nginx created
serviceaccount/ingress-nginx created
serviceaccount/ingress-nginx-admission created
role.rbac.authorization.k8s.io/ingress-nginx created
role.rbac.authorization.k8s.io/ingress-nginx-admission created
clusterrole.rbac.authorization.k8s.io/ingress-nginx created
clusterrole.rbac.authorization.k8s.io/ingress-nginx-admission created
rolebinding.rbac.authorization.k8s.io/ingress-nginx created
rolebinding.rbac.authorization.k8s.io/ingress-nginx-admission created
clusterrolebinding.rbac.authorization.k8s.io/ingress-nginx created
clusterrolebinding.rbac.authorization.k8s.io/ingress-nginx-admission created
configmap/ingress-nginx-controller created
service/ingress-nginx-controller created
service/ingress-nginx-controller-admission created
deployment.apps/ingress-nginx-controller created
job.batch/ingress-nginx-admission-create created
job.batch/ingress-nginx-admission-patch created
ingressclass.networking.k8s.io/nginx created
validatingwebhookconfiguration.admissionregistration.k8s.io/ingress-nginx-admission created

controlplane:~$ kubectl create namespace ingress-ngnix
namespace/ingress-ngnix created
controlplane:~$ kubectl apply -f https://raw.githubusercontent.com/kubernetes/ingress-nginx/controller-v1.8.1/deploy/static/provider/baremetal/deploy.yaml
namespace/ingress-nginx created
serviceaccount/ingress-nginx created
serviceaccount/ingress-nginx-admission created
role.rbac.authorization.k8s.io/ingress-nginx created
role.rbac.authorization.k8s.io/ingress-nginx-admission created
clusterrole.rbac.authorization.k8s.io/ingress-nginx created
clusterrole.rbac.authorization.k8s.io/ingress-nginx-admission created
rolebinding.rbac.authorization.k8s.io/ingress-nginx created
rolebinding.rbac.authorization.k8s.io/ingress-nginx-admission created
clusterrolebinding.rbac.authorization.k8s.io/ingress-nginx created
clusterrolebinding.rbac.authorization.k8s.io/ingress-nginx-admission created
configmap/ingress-nginx-controller created
service/ingress-nginx-controller created
service/ingress-nginx-controller-admission created
deployment.apps/ingress-nginx-controller created
job.batch/ingress-nginx-admission-create created
job.batch/ingress-nginx-admission-patch created
ingressclass.networking.k8s.io/nginx created
validatingwebhookconfiguration.admissionregistration.k8s.io/ingress-nginx-admission created

controlplane:~$ kubectl get pods -n ingress-nginx
NAME                                        READY   STATUS      RESTARTS   AGE
ingress-nginx-admission-create-wjmb8        0/1     Completed   0          29s
ingress-nginx-admission-patch-nvst7         0/1     Completed   0          29s
ingress-nginx-controller-5c5949d455-8zn8s   1/1     Running     0          29s
controlplane:~$ kubectl get svc -n ingress-nginx
NAME                                 TYPE        CLUSTER-IP       EXTERNAL-IP   PORT(S)                      AGE
ingress-nginx-controller             NodePort    10.110.76.184    <none>        80:30384/TCP,443:32500/TCP   61s
ingress-nginx-controller-admission   ClusterIP   10.105.205.149   <none>        443/TCP                      61s
controlplane:~$ kubectl create deployment nginx-app --image=nginx --replicas=2 -n test
error: failed to create deployment: namespaces "test" not found
controlplane:~$ kubectl create ns test
namespace/test created
controlplane:~$ kubectl create deployment nginx-app --image=nginx --replicas=2 -n test
deployment.apps/nginx-app created
controlplane:~$ kubectl expose deployment nginx-app --name=nginx-service --port=80 --target-port=80 -n test
service/nginx-service exposed
controlplane:~$ kubectl get pods -n test
NAME                         READY   STATUS    RESTARTS   AGE
nginx-app-766796df68-826f9   1/1     Running   0          56s
nginx-app-766796df68-ggz4p   1/1     Running   0          56s
controlplane:~$ kubectl get svc -n test
NAME            TYPE        CLUSTER-IP      EXTERNAL-IP   PORT(S)   AGE
nginx-service   ClusterIP   10.97.195.253   <none>        80/TCP    52s
controlplane:~$ kubectl get svc -n test -o wide
NAME            TYPE        CLUSTER-IP      EXTERNAL-IP   PORT(S)   AGE     SELECTOR
nginx-service   ClusterIP   10.97.195.253   <none>        80/TCP    2m43s   app=nginx-app
controlplane:~$ 

controlplane:~$ kubectl apply -f ingress-host-based.yaml 
ingress.networking.k8s.io/host-based-ingress created
controlplane:~$ kubectl get ingress -n test
NAME                 CLASS   HOSTS         ADDRESS       PORTS   AGE
host-based-ingress   nginx   nginx.local   172.16.20.6   80      33s
controlplane:~$ kubectl describe ingress host-based-ingress -n test
Name:             host-based-ingress
Labels:           <none>
Namespace:        test
Address:          
Ingress Class:    nginx
Default backend:  <default>
Rules:
  Host         Path  Backends
  ----         ----  --------
  nginx.local  
               /   nginx-service:80 (10.244.1.6:80,10.244.1.7:80)
Annotations:   <none>
Events:
  Type    Reason  Age                From                      Message
  ----    ------  ----               ----                      -------
  Normal  Sync    67s (x2 over 67s)  nginx-ingress-controller  Scheduled for sync
  Normal  Sync    10s                nginx-ingress-controller  Scheduled for sync
controlplane:~$ 
Network Policy:
K8S API objects that act as Layer 3/4 firewalls and controlling pod-to-pod and pod-to-external communication.
Security Model: It will deny by default, we can define explicitly allow what's needed.
Container Network Interface (CNI) : K8S delegates network implementation to CNI plugins.
It will act as OR operation if multiple entries. It will allow traffic to any matching destination is allowed simultaneously.
Microservice Policy:
3 Tier Architecture : Web (frontend), API (backend), Database (persistent layer)
Traffic Flow: Client -> web:80, Web -> API:8080, API -> Database:5432
Policy Layer 1:  Web pods have egress to API pods on port 8080, deny all other egress exceptDNS
Policy Layer 2: API pods have ingress from web pods on 8080 and egress to Database pods on 5432 and deny all else.
Policy Layer 3: Database pods have ingress from API pods on 5432 only and never initiates outbound
Debugging of Network policy:
  • Connection Timeout/ Refused : Check if a policy is selecting the pod and list polices in the namepsace.
  • List policy - kubect get networkpolicy -n namespace | grep pod-label
  • Describe policy - kubectl describe networkpolicy name -n namepsace
  • check pod labels : kubectl get pods -n namespace --show-labels
  • Test connectivity : kubectl exec source-pod -- curl destination-pod:port -v
  • Check for DNS issues - If application cannot resolve hostnames, policy may missing egress of that host.
  • CNI logs: kubectl logs -n kube-system calico-node/cilium-agent | grep DENIED

Monday, June 23, 2025

Ansible Modules

June 23, 2025 0


inlinefile module:

Adding /Modify or delete a line inside of file.
Main parameter:
path - full path of the file
line - text
insertbefore / insertafter - EOF/regular expression
validate - Validation of command
state - Present/absent
mode/owner/group - permission
setype/seuser/selevel - SElinux setup
Ping Module:
It is validated the host reachability of remote host.
ansible.builtin.ping is a module name.
Reboot Module:
We can reboot a remote host through reboot module.
Main parameter of this reboot module as below:
reboot_timeout - 600
msg - text of reboot notification
reboot_command - define a reboot command depends up on OS
pre_reboot_delay - 0
Post_reboot_delay - 0
test_command - 'whoami'
boot_time_command - "cat /proc/sys/kernel/boot_id"

Copy Module:
Copy a file from one location to other location.
Main Parameters:
dest - Remote file path
src - local file path
fail_on_missing - yes / no
validate_checksum - yes /no
flat - yes/no
Service Module:
We can enable and disable the system services through this module.
ansible.builtin.service_facts
Main parameters:
name : Service name
state :  started, stopped, restarted, reloaded
enabled: yes/no
arguments/args : extra args
Package installation module:
Main parameters:
name - Name of the package
state - present/installed/absent/removed/latest
Create a file:
Main parameter:
path - file path
state - absent/directory/hard/link/touch
Module for a file permission change:
Main parameters:
Path - file path
owner - user
group - group
mode - rwx mode
state - file state [absent/directory/hard/link/touch]
setype/seuser/selevel - SElinux
Module for Download a file through Internet
Main parameters:
url - download URL
dest - destionation path
force - no/yes
checksum - checksum:URL
force_basic_auth/url_username/url_password/use_gssapi - HTTP basic auth/GSSAPI kerberos
headers - custom HTTP headers
http_agent - ansible-http-get
owner/group/mode - permission
setype/seuser/selevel - SElinux

Example:
---
 - name: Download an ansible package
   hosts: all
   become: false
   gather_facts: false
   vars: 
     myurl: "https://releases.ansible.com/ansible/ansible-2.9.25.tar.gz"
mycrc: "sha256:https://releases.ansible.com/ansible/ansible-2.9.25.tar.gz"
mydest: "/home/test/ansible-2.9.25.tar.gz"
   tasks:
     - name: downloading an ansible file
   ansible.builtin.get_url:
     url: "{{ myurl }}" 
desk: "{{ mydest }}"
checksum: "{{ mycrc }}"
mode: '0644'
owner: devops
group: wheel
Module for backing up the file
Main Parameters:
src - source path
dest - destionation path
archive - mirrors the rsync archive flag, enables recursive, links, perms, times, owner, group, flags 
rsync_opts - no/yes

Changed the line inside of file:
---
- name: search demo
  hosts: all
  vars:
    myfile: "/etc/ssh/sshd_config"
    myline: 'PasswordAuthentication no'
  become: true
  tasks:
    - name: string found
      ansible.builtin.lineinfile:
        name: "{{ myfile }]"
        line: "{{ myline }}"
        state: present
      check_mode: true
      register: conf
      failed_when:(conf is changed) or (conf is failed)

Monday, May 12, 2025

Prometheus - Write a Query through PromQL - Part 2

May 12, 2025 0


PromQL:
PromQL expressions has classified as follows:
Instant Vector
Range Vector
Scalar
String
Instant and Range vector has a basic syntax consist of metric name along with label matchers. A metric name in Prometheus is a label named __name__ under the value. 
example:
{__name__="prometheus_build_info"}
PromQL will query directly by name [prometheus_build_info]

Label matchers are defined using a label key, a label matching operator, and the label value. Some possible label-matching operators:
=: The label value matches the specified string
!=: The label value does not match the specified string
=~: The label value matches the regex in the specified string
!~: The label value does not match the regex in the specified string

Instant Vector are selectors that select the data at this instant using a recent available data for the time series which you are selected. 
Range Vector is retriving data over a given time range. This time range is specified as duration followed by unit.
The following are valid units for a duration:

ms: Milliseconds
s: Seconds
m: Minutes
h: Hours
d: Days (assumes a day is always 24 hours)
w: Weeks (assumes a week is always 7 days)
y: Years (assumes a year is always 365 days)

These range vector selectors are often more useful when aggregating data to perform an analysis to drive results such as the number of requests per second a service experienced over a particular time range.
Prometheus has two primary API endpoints that are used to retrive time series data /api/v1/query and /api/v1/query_range.
Note : Both instant vectors and range vectors are valid for the /query endpoint, but only instant vectors are valid for the /query_range endpoint.
Offsets:
It will allow us to pull the time series data from the past based on offset values.
Example:
my_cool_custom_metric offset 5m
Group Modifier and Vector Matching:
Prometheus has provided ways to join the labels of different matrics together when using the group_left and group_right query modifiers. This option allows for many-to-one and one-to-many matching of vectors.
Logical and set binary operators
PromQL used the boolean operators of and,or and unless query operators
Example:
vector1 and vector2
It requires that for every series in vector1, there must be an exactly matching label set in vector2 (besides the __name__ label). If there is no match for the label set of a series in vector1 inside of vector2, then that series is not included in the results.  

Sunday, May 4, 2025

Prometheus - Time Series Database - Part 1

May 04, 2025 0


Prometheus Installation:

We can install the Prometheus in different ways.
  •  Install through source
  • Docker container
  • Install through script
  • Install through package manager
Prometheus with a metrics comes from node_exporter process from remote hosts. Each metrics has associated with one or more-time series data on it.
Events are point-in-time of record of action occurring during that time.
Prometheus is using a pull-based model for extracting the data from systems it monitors whereas Graphite and Nagios are using push-based model which push the metrics to a remote system.
Components of Prometheus Stack:
  • Prometheus Alert manager for routing an alert coming from Prometheus 
  • Exporters: It has multiple exporter components depends upon a device such as Node Exporter.
  • Grafana: It used to visualize metrics from Prometheus through dashboards.
Prometheus has four main components such as time series database [TSDB], scrape manager, rule manager and Web UI.
Time Series Database:
   It is a special kind of database that is optimized for storing data points in a time series manner. The core part of TSDB are head blocks [Write-ahead log] and data format (block, chunks, and indices). The head block is an entry point for samples being scraped and stored in TSDB. 
The chunk gets appending into head block, until chunk hits it sample limit until stays in memory. It will add into WAL at first before added into memory, so we will preserve the data if server is in panic or reboot at automatically.
To increase resource efficiency, some wizardry is done to the chunk data so that it only stores the direct value of the first timestamp (t0) and first value (v0). Subsequent timestamps are set to the delta of the prior timestamp, so starting at t2, all timestamps are the delta of a delta. Similarly, subsequent values are compared to their prior value using a bitwise XOR operator. This just means that the difference between the samples is stored, and if they’re the same, then 0 is stored.
Scrape Manager:
  The scrape manager is a part of Prometheus that handles pulling metrics from applications and exporters by performing scraping and maintaining an internal list of what things should be scraped by Prometheus.
Rule Manager:
  The rule manager is part of Prometheus that handles evaluating alerts and recording the rules as per Prometheus. It is handling evaluating rule groups compromised of alerts and recording rules on regular intervals. 
Web UI/API:
  The Web UI/API is the portion of Prometheus that you can access via your browser. The Prometheus UI/API is a powerful REST API. It provides integration with other graphical tools such as Grafana. 
Alert Manager:
  It is responsible to send an alert to Slack, PagerDuty and other alerting destinations.  Alert Manager handles all of that owns through routing tree-based workflow. 


Saturday, April 12, 2025

Terraform - Part 2

April 12, 2025 0


Terraform Workflow:
Terraform workflows consist of five fundamental steps:


Write - Create  a module of your code
Init - Initialize your code with download of required plugins of provider.
Plan - Review and predict the changes and determine whether to accept this changes.
Apply - Implement the changes in the real environment.
Destroy - Destroying the infra structure which we created.


We can validated the file format through terraform fmt command.

[root@thiru project]# terraform fmt main.tf
╷
│ Error: Invalid multi-line string
│
│   on main.tf line 15:
│   15: resource "aws_instance" "Web_server {
│   16:   ami =
│
│ Quoted strings may not be split over multiple lines. To produce a multi-line string, either use the \n escape to represent a newline character or use the
│ "heredoc" multi-line template syntax.
╵

╷[root@thiru project]# terraform fmt main.tf
[root@thiru project]#


Sunday, March 9, 2025

Terraform - Part 1

March 09, 2025 0

Terraform Installation

• yum install -y yum-utils shadow-utils
• yum-config-manager --add-repo https://rpm.releases.hashicorp.com/AmazonLinux/hashicorp.repo
• yum -y install terraform
• terraform version
• terram -help
• terraform -help plan

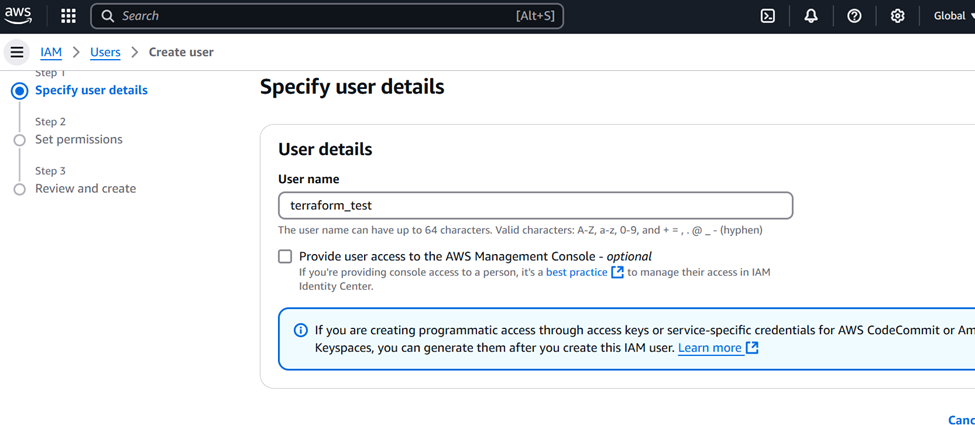
Create AWS user for the terraform setup

Create a user in AWS:

1) Login into Aws console

2) Navigate into IAM


3) Click on create user button


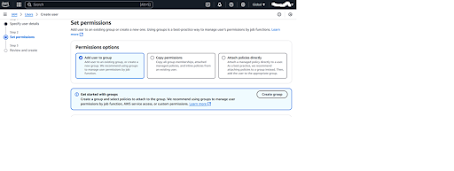
4) Set a permission of new user


5) Click on created user and we can able to see the option for create a key for that specific user.


6) It will prompt the use case of your requirement.


7) Choose the Command Line Interface option 

8) Take a note of Access Key and secret access key. We need to define these parameter inside of Terraform while automate the infrastructure.

Terraform Architecture:

* Terraform follows a declarative approach to infrastructure management which mention a desire state of your infrastructure through configuration files. It takes care of provisioning and configuration of resources to achieve that state.


Terraform has consist of four components.
* Providers
* Modules
* Resources
* Templates
Providers:
It is an essential plugins that provide a interaction between Terraform and remote machines such as Azure, AWS, GCP, VMware and local environments. Terraform uses to providers to provision of resources such as virtual networks and compute instances. We cannot able to create or manage a resources if we are not include the providers in our script.
We need to declare a provider as your root module so that it will inherit with child modules where we can define our desire state of our infrastructure.
Modules:
Module is a collection of template files that resides on a single directory. Module is considered a child module of the template. Modules can be present in local or remote location. Terraform is supporting multiple resources such as Terraform Registry, version control systems, HTTP URLs and private module registries in Terraform.
Resources:
Terraform uses resources blocks to manage various kinds of infrastructure such as virtual networks, compute instances and DNS records. The resource blocks map to one or more infrastructure objects within your Terraform configuration.
Templates:
Terraform template is a collection of files that define the desired state of your infrastructure to be maintained. 


Friday, March 7, 2025

Terraform Introduction

March 07, 2025 0


Terraform Introduction:
Terraform helps user to build, manage or change infrastructure through code. 

Terraform Vs Ansible

IAC [Infrastructure as code]


  • Manage infrastructure with the help of code
  • It's the code used to provision resources including virtual machines such as instances on AWS , Network infrastructure including gateways etc
  • You write and execute the code to define, deploy, update and destroy your infrastructure
  • Code is tracked in a SCM repository
  • Automation makes the provisioning process consistent, repeatable and updates fast and reliable.
  • Ability to programmatically deploy and configure resources
  • IAC standardize your deployment workflow
  • IAC can be shared, reused and versioned.
• IAC Tools:
    1.Terraform
    2.CloudFormation
    3.Azure Resource Manager
    4.Google Cloud Deployment Manager  
Terraform Overview:
• Terraform is an Infrastructure Building Tool (Provisioning Infrastructure)
• Written in Go Language
• Integrates with configuration management and provisioning tools like Chef, Puppet and Ansible.
• Extension of the file is .tf or .tf.json (Json Based)
• Terraform maintain a state with the .tfstate extension
• Deployment of infrastructure happens with a push-based approach (no agent to be installed on remote machines)
• Terraform is Immutable. It can’t be changed after it’s created and destroy is the only option.
• Terraform is using a Declarative method, Declarative Language is Describing what you're trying to achieve without instructing how to do it.
• Terraform is Idempotent ,what ever looking for you which already is present means don't apply and exit without any changes.
• Providers are services or systems that Terraform interacts with to build infrastructure on.
• Current Terraform Version is 1.11
• Terraform is cloud-agnostic but requires a specific provider for the cloud platform
• Single Terraform configuration file can be used to manage multiple providers
• Terraform can simplify both management and orchestration of deploying large-scale, multi-cloud infrastructure
• Terraform is designed to work with both public cloud platforms and on-premises infrastructure (private cloud)
• Terraform Workflow
        1.Scope 2.Author 3.Intilaize 4.Plan 5.Apply
 
Configuration file of Terraform:


Terraform is consist of 3 blocks such as terraform block, provider block and resources block.
Terraform Block:
It defined a terraform required version and required provider of terraform.
Provider Block:
It define the cloud provider plugin along with region where need to provision the infra structure.
Resource Block:
It provide the resource allocation or built a infra structure of your requirement. For example
"aws instance" is an AWS API  and Web server is a Terraform name of the block.

resource "aws instance" "Web server" {
ami ="image name"
instance type = "t2.micro"
tag = {
    Name = "Web Instance"
}


Monday, March 3, 2025

Datadog Introduction

March 03, 2025 0


Datadog Monitoring Tool:
    Observability is essential for managing modern infrastructure and applications. It brings together real-time metrics from servers, containers, databases, and applications. It achieves this with end-to-end tracing. That’s not all that it can do. It comes up with helpful alerts and fascinating visualizations, offering full-stack observability.

Observability of three metrics [Rate, errors and duration] provide a well rounded view of service performance.
Rate : Monitoring a HTTP and API calls of your services
We will get to know the service over load for monitoring the HTTP and API calls. We will take action if any spikes or sudden drops in the rate of requests. It could indicate issues such as sudden traffic surges, DDos attacks or failures in the upstream.
Errors: Track how many of those request fail.
The error could be server error, database error or failed API calls. We can quickly identify issues with our application or backend system while tracking these errors.
Duration: Measure how long those requests take with latency
High latency will degrade a user experience particularly for real time or interactive applications. Monitoring of duration will allow us to detect a performance bottlenecks before they affect our users.

Below are few of the Datadog monitoring types and we can create and use it.

APM: Monitor application performance monitoring (APM) metrics or trace queries.
Metric: Compare values of a metric with a user-defined threshold.
Logs: Alert when a specified type of log exceeds a user-defined threshold over a given period of time.
Database Monitoring: Monitor query execution and explain plan data gathered by Datadog.
Error Tracking: Monitor issues in your applications gathered by Datadog.
Real User Monitoring: Observe user behavior and monitor frontend performance.
Synthetic Monitoring: Simulate user actions to test API endpoints or website functionality.
Anomaly: Detect anomalous behavior for a metric based on historical data.
Cloud Network Monitoring: Monitor cloud-specific network configurations and traffic.

Infrastructure Monitoring: 
Datadog can monitor the performance and health check of our entire infrastructure. This includes servers, containers, databases, and cloud services. It provides:
  • Metrics collection
  • Visualizations and dashboards
  • Alerting
  • Anomaly [behaves differently than usual] monitoring
  • Infrastructure maps
  • Logs and traces integration
  • Automation
Application Performance Monitoring (APM)
Datadog offers APM functionality to monitor and optimize the performance of your applications. It provides detailed visibility into application code, dependencies, and performance bottlenecks. With it, you can track response times, error rates, and throughput. What’s more, you can gain visibility into the performance of individual requests.

Distributed Tracing
Distributed tracing, Datadog allows teams to trace requests as they flow through your complex, distributed systems. It helps you to:
  • Identify latency issues
  • Understand dependencies between services
  • Troubleshoot performance problems across microservices architectures
  • You can see how you can easily identify the root causes of application performance issues. It collects data moving between services.
Log Management
Datadog enables centralized log management. This allows you to collect, index, search, and analyses logs from various sources. You can aggregate Datadog logs from multiple systems and applications. You can set up alerts based on log events. Also, you can collect the customized logs from the servers.
Real-time Metrics and Dashboards
 Datadog provides real-time metrics and customizable dashboards. A Datadog dashboard helps to visualize and monitor the health and performance of our systems. You can create visualizations, charts, and graphs to:
  • Track key metrics
  • Set up alerts based on thresholds
  • Share dashboards with your team
Collaboration and Notifications
Datadog offers collaboration features that allows teams to work together effectively. You can annotate and share graphs, dashboards, and alerts. You can even set up notifications via email, SMS, or third-party integrations. Want to integrate incident management tools like Slack, Jira, and PagerDuty? No problem. You can even collaborate on troubleshooting and resolving issues.
Integration and Extensibility
Datadog integrates with a wide range of tools and services. As you can imagine, this makes it easy to collect data from various sources. You can integrate Datadog with all the popular cloud platforms. Don’t stop there, you can integrate it with all your existing workflows.

Saturday, March 1, 2025

Creating AWS Load Balancer Controller under EKS in the AWS environment

March 01, 2025 0


 AWS Load Balancer Controller:

Architecture diagram


Associates an OIDC provider with your EKS cluster:

eksctl is a CLI tool for EKS cluster in AWS. We can able to map the existing OIDC provider into EKS cluster through below CLI command.

#eksctl utils associate-iam-oidc-provider --cluster test-demo-cluster  --approve --region us-east-2

Created an IAM role for the EKS cluster:

An Amazon EKS cluster IAM role is required for each cluster. Kubernetes clusters managed by Amazon EKS use this role to manage nodes and the legacy Cloud Provider uses this role to create load balancers with Elastic Load Balancing for services.

Creating the Amazon EKS cluster role:

You can use the AWS Management Console or the AWS CLI to create the cluster role.
AWS Management Console
Open the IAM console at https://console.aws.amazon.com/iam/.
Choose Roles, then Create role.
Under Trusted entity type, select AWS service.
From the Use cases for other AWS services dropdown list, choose EKS.
Choose EKS - Cluster for your use case, and then choose Next.
On the Add permissions tab, choose Next.
For Role name, enter a unique name for your role, such as eksClusterRole.
For Description, enter descriptive text such as Amazon EKS - Cluster role.
Choose Create role.

AWS CLI
a) Copy the following contents to a file named EKS-loadbalancer-policy.json.
{ "Version": "2012-10-17", "Statement": [ { "Effect": "Allow", "Principal": { "Service": "eks.amazonaws.com" }, "Action": "sts:AssumeRole" } ] }

b) Create an IAM policy:

#aws iam create-role \
  --role-name AWSLoadBalancerControllerIAMPolicy  \
  --assume-role-policy-document file://"EKS-loadbalancer-policy.json"

Set up an IAM service account in an EKS cluster, allowing the AWS Load Balancer Controller to manage AWS Load Balancers on behalf of the Kubernetes cluster.

  • Creates a Kubernetes ServiceAccount named aws-load-balancer-controller.
  • Associates it with an IAM Role (AmazonEKSLoadBalancerControllerRole).
  • Attaches the AWSLoadBalancerControllerIAMPolicy.
  • Allows Kubernetes to use AWS IAM for authentication.

eksctl create iamserviceaccount \
  --cluster=alb-demo-cluster \
  --namespace=kube-system \
  --name=aws-load-balancer-controller \
  --role-name AmazonEKSLoadBalancerControllerRole \
  --attach-policy-arn=arn:aws:iam::<aws-account-id>:policy/AWSLoadBalancerControllerIAMPolicy \
  --region us-east-2 \
  --approve

Validated the controller:
#kubectl get deployment -n kube-system aws-load-balancer-controller

Step 2: Install AWS Load Balancer Controller:

Install the AWS Load Balancer Controller.
Installs the AWS Load Balancer Controller in the kube-system namespace.
Links it to the existing aws-load-balancer-controller service account.
#helm install aws-load-balancer-controller eks/aws-load-balancer-controller \
  -n kube-system \
  --set clusterName=alb-demo-cluster \
  --set serviceAccount.create=false \
  --set serviceAccount.name=aws-load-balancer-controller

Step 3: Validated the load balancer:

#kubectl get deployment -n kube-system aws-load-balancer-controller